In This Article
Every mortgage company has a junk drawer. Not the one in the kitchen, the one in your IT budget. It is packed with SaaS subscriptions nobody remembers buying, integration middleware that three people understand, and licensing fees for tools that duplicate what another tool already does. The average company now manages 254 SaaS applications, and 52.7% of those licenses sit unused according to Zylo's 2025 SaaS Management Index. In mortgage operations, where margins are already razor-thin, that junk drawer is bleeding money you cannot afford to lose.
This is Part 1 of a two-part series. Here, we break down where IT complexity hides its costs: in labor, in integration overhead, in compliance risk, and in your cost per loan. In Part 2, we cover what to do about it.
The cost to originate a single mortgage loan hit $11,109 in Q3 2025, up from $10,965 in Q2 and 42% above the long-term industry average of $7,799. Independent mortgage banks saw even steeper numbers, with Freddie Mac reporting $11,800 per loan for retail-only originators.
Those are not just numbers on a report. They represent the compounding cost of systems that were bolted together over years, never designed to work as one, and now require armies of people to keep running.
The Real Cost of Tool Sprawl
Mortgage technology stacks have grown by accretion. A new LOS here, a compliance overlay there, a borrower portal from this vendor, an e-closing tool from that one. Each solved a problem in isolation. None was designed to talk to the others.
STRATMOR Group's research quantifies the damage: lenders running fragmented technology stacks report per-loan costs 30% higher than those with consolidated platforms. That gap comes not from the software licenses themselves, those are the visible line items, but from everything required to make those systems function together.
Fragmented Stack (Typical Lender)
- 12-18 disconnected point solutions
- Manual data re-entry between systems
- Inconsistent borrower data across platforms
- IT team spends 60%+ on maintenance
- Compliance gaps at every system boundary
Integrated Platform (Top Performers)
- Core platform with native integrations
- Automated data flow from application to closing
- Single source of truth for borrower records
- IT team focused on optimization and strategy
- Unified compliance controls and audit trails
The difference between the top quartile and bottom quartile is staggering. Freddie Mac's Q2 2025 data shows top-performing lenders originating at roughly $6,900 per loan while bottom performers spend $16,500, a gap of nearly $10,000 per file. Technology consolidation is the single biggest differentiator between those groups.

The Hidden Labor Tax
Here is where the costs really hide: people. Not the people you hired to originate and close loans, but the time those people spend wrestling with technology instead of doing their actual jobs.
Every context switch between applications costs 23 minutes to fully refocus, according to research from the University of California, Irvine. A loan processor toggling between an LOS, a document management system, a compliance tool, and email is not just inconvenienced, they are losing hours of productive work every day. Multiply that across your operations team, and the labor cost of IT complexity dwarfs the licensing fees.
A loan processor handles 8 files per day and switches between 5 applications per file. Each switch costs 10 minutes of lost focus and re-orientation (conservative estimate vs. the 23-minute research benchmark).
That is 400 minutes, 6.6 hours, of lost productivity per day for a single processor. Across a team of 10, that equals 33 hours of wasted capacity every day, or roughly 4 full-time employees doing nothing but context-switching.
This matters more now than it did five years ago. The mortgage industry lost 34% of its licensed mortgage loan originators between Q4 2021 and mid-2025, dropping from 125,000 to approximately 82,500 according to MBA and NMLS data. The average MLO is 45 years old. Only 10% are between 20 and 30. You cannot afford to waste the capacity of the people you have left.
Borrower-paid fees have already risen 30% between 2021 and 2024 per MBA and HMDA analysis. When your internal costs are inflated by IT friction, those costs get passed through, or they eat your margin. Neither outcome is sustainable.
The Integration Maintenance Trap
Custom integrations are the silent budget killer in mortgage IT. Every point-to-point connector between systems costs $25,000 to $100,000 to build, and then demands roughly 20% of that cost annually just to maintain. When a vendor updates their API (and they will), when a regulation changes the data fields you need to capture (and it will), every custom integration touching that system needs to be retested, updated, and redeployed.
| Integration Type | Build Cost | Annual Maintenance | Failure Risk |
|---|---|---|---|
| LOS to Document Management | $50K to $100K | $10K to $20K/yr | High (frequent API changes) |
| LOS to Compliance Engine | $40K to $80K | $8K to $16K/yr | High (regulatory field changes) |
| CRM to LOS | $25K to $60K | $5K to $12K/yr | Medium |
| E-Closing to LOS | $30K to $70K | $6K to $14K/yr | Medium |
| Borrower Portal to LOS | $25K to $50K | $5K to $10K/yr | Medium |
A lender with 8 custom integrations is spending $300,000 to $500,000 just to build them, then $50,000 to $100,000 per year to keep them running. That annual maintenance budget buys you no new capability. It just keeps the lights on.
This is why lenders that have moved to cloud-hosted platforms with native integrations report dramatically lower IT overhead. When your LOS, document management, and compliance tools share a common infrastructure, you are not paying to maintain bridges between islands, the islands were never separated in the first place.
Compliance Risk: The Complexity Multiplier
Disconnected systems do not just cost money. They create compliance exposure. When borrower data lives in 6 different systems with 6 different access controls, 6 different retention policies, and 6 different audit trails, proving compliance to examiners becomes an exercise in archaeology.
The SitusAMC breach in November 2025 illustrates this perfectly. Unauthorized actors accessed SitusAMC's systems for 10 days, from November 12 through November 21, extracting loan file due diligence records, borrower PII including Social Security numbers, dates of birth, and financial account details. FINRA flagged that "potentially billions of loan-related documents" were exposed. JPMorgan Chase, Citi, and Morgan Stanley were among the banks that had to notify customers. SitusAMC manages over $500 billion in assets for approximately 1,500 clients.
The Third-Party Risk You Cannot Ignore
Verizon's 2025 Data Breach Investigations Report found that third-party breaches jumped to 30% of all incidents, double the prior year. SecurityScorecard reported that 97% of the top 100 U.S. banks experienced a third-party breach in 2024. IBM's 2025 Cost of a Data Breach report puts the average third-party breach at $4.91 million. Every disconnected vendor in your stack is another attack surface.
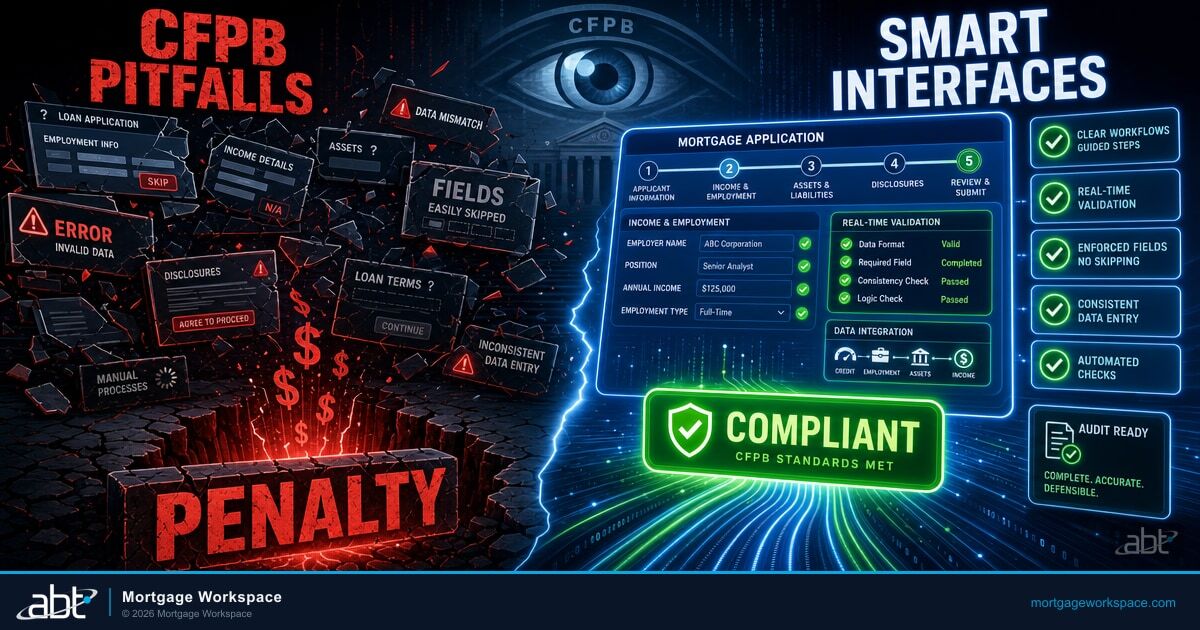
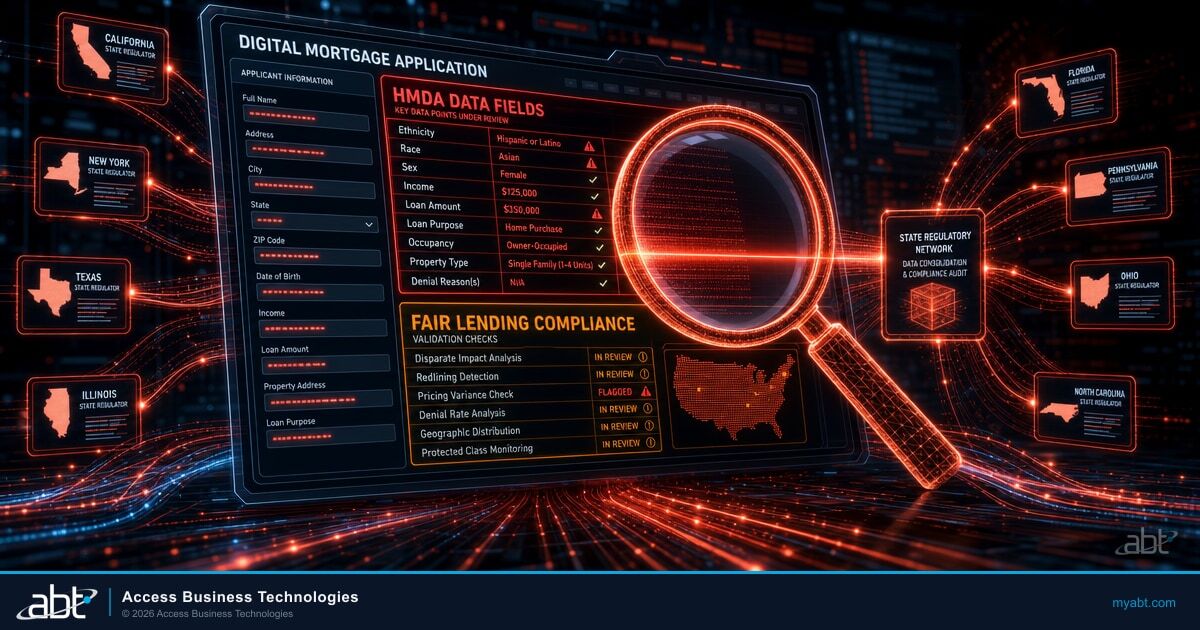
The regulatory environment is tightening in response. The AVM Final Rule, issued jointly by six federal agencies and effective mid-2025, requires five quality control factors including data accuracy, difficult to prove when your valuation data passes through three systems before reaching the investor. The CFPB is pursuing a $20 million penalty against a lender for more than 150,000 HMDA reporting errors stemming from what regulators called "systemic deficiencies" in data management. Those are not one-off mistakes. They are what happens when data is manually reconciled across disconnected platforms.
For lenders preparing for CFPB examinations with Microsoft 365, the gap between having data and being able to prove you have the right data is exactly where IT complexity creates regulatory risk. The lenders who pass clean exams have moved their audit, retention, data-loss prevention, and supervisory controls into Microsoft Purview, where Purview Audit Premium produces the time-stamped trail across Exchange Online, SharePoint, OneDrive, and Teams, retention policies bind tamper-evident retention to borrower files, and Communication Compliance flags off-channel correspondence before it becomes a finding. That is consolidation as a compliance control, not just a cost-savings exercise.
What This Means for Your Cost Per Loan
Pull all of these threads together and the picture is clear. IT complexity does not appear as a line item on your cost-per-loan report. It hides in labor inefficiency, in integration maintenance, in compliance remediation, and in the opportunity cost of an IT team that spends its time keeping old systems alive instead of building competitive advantage.
Labor Waste
Context switching, manual data entry, and system troubleshooting consume 30-40% of operations staff capacity in fragmented environments.
Integration Tax
Custom connectors cost $25K-$100K to build and 20% annually to maintain. Eight integrations means $50K-$100K/year in pure maintenance.
Compliance Exposure
Each disconnected system is a separate audit scope, a separate breach surface, and a separate point of regulatory failure.
Opportunity Cost
83% of lenders plan to increase GenAI budgets in 2026. Lenders whose IT teams are buried in maintenance will miss the window entirely.

Integrated platforms report 2.5x faster loan closures. That speed advantage compounds: faster closures mean better borrower experience, better pull-through rates, and lower cost per funded loan. With 57% of industry leaders predicting AI-driven underwriting will be the biggest industry change in 2026 (per National Mortgage News), the lenders who have already simplified their stacks will be the ones positioned to adopt AI tools that actually work.
The question is no longer whether you can afford to consolidate your technology stack. With origination costs at $11,109 per loan and climbing, the question is whether you can afford not to.
The Direct-Bill CSP Consolidation Path
Consolidation has a specific shape that works in mortgage operations, and it starts with where you buy your Microsoft licensing. A Microsoft Direct-Bill Cloud Solution Provider is the small subset of Microsoft partners that transacts directly with Microsoft for customer licensing, holds dedicated Microsoft support engineers, and is operationally accountable to Microsoft for how customer tenants are configured. Access Business Technologies is a Tier-1 Direct-Bill CSP, and we manage Microsoft 365 tenants for more than 750 financial institutions including independent mortgage banks, regional lenders, and hybrid bank-mortgage organizations. The Direct-Bill relationship is not a procurement detail. It is the partner-side authorization that allows a single operating owner to apply consistent identity, device, communication, and recordkeeping controls across an entire lender's footprint under Granular Delegated Administrative Privileges (GDAP), scoped per tenant and per role. That is the regulatory frame that satisfies the third-party service provider oversight expectations baked into amended Regulation S-P and the CFPB's third-party risk management guidance.
The Microsoft baseline is one half of the picture. The operating model that runs on top of it is the other half. ABT layers M365 Guardian, our financial-services operating model for Microsoft 365, on top of the Direct-Bill CSP relationship. For a mortgage lender, Guardian means a Conditional Access posture in Microsoft Entra ID tuned for branch geography and remote-LO behavior, Microsoft Intune device enrollment with mortgage-specific compliance baselines, Microsoft Purview retention policies aligned to RESPA, HMDA, and CFPB recordkeeping expectations, Microsoft Defender for Office 365 and Defender for Endpoint configured against actual mortgage-targeted phishing patterns rather than vendor SMB defaults, and a Microsoft Sentinel deployment that pulls every signal into one incident timeline ready for examiner production. The lender keeps its tenant ownership and its regulatory relationships. The Guardian layer is what makes the consolidation produce evidence, not just savings.
The Path Forward: Consolidation Over Addition
The instinct when a new problem surfaces is to buy another tool. That instinct is exactly how mortgage companies end up with 15 overlapping systems and a six-figure integration budget. The fix is not more technology. It is less, but better-integrated, technology.
Start with an honest inventory. How many SaaS licenses does your organization actually use? If you are close to the industry average, more than half of them are sitting idle. Which integrations are custom-built, and what do they cost to maintain annually? Where does borrower data move between systems manually, and what is the error rate?
Cloud-based platforms that consolidate core mortgage workflows, including cloud migration strategies that work, eliminate the integration tax entirely. When your LOS, collaboration tools, and compliance infrastructure run on the same platform, you stop spending money connecting things and start spending it on making things faster. Tools like Microsoft Teams automation can replace three or four standalone notification and workflow systems without adding another vendor to manage.
In Part 2 of this series, we walk through a concrete consolidation framework: how to audit your current stack, identify the highest-ROI consolidation targets, and build a migration plan that does not disrupt operations while you execute it.
Key Takeaway
IT complexity is a productivity tax that compounds into a compliance liability. The fastest path out is consolidation onto a Microsoft 365 footprint operated by a Tier-1 Direct-Bill Cloud Solution Provider under the M365 Guardian operating model, with Microsoft Purview as the audit-and-retention backbone. The licensing simplifies, the integration tax disappears, and the audit evidence is ready before an examiner asks for it.
Consolidate Your Mortgage IT With a Tier-1 Direct-Bill CSP
Lenders with consolidated platforms originate at $6,900 per loan. ABT's M365 Guardian operating model, layered on a Tier-1 Direct-Bill CSP relationship, applies a single Microsoft Entra ID, Intune, Defender, and Microsoft Purview baseline across your entire footprint. Talk to a mortgage IT strategist about what the consolidation path looks like for your operation.
Frequently Asked Questions
STRATMOR Group research shows that lenders with fragmented technology stacks pay 30% more per loan than those with consolidated platforms. With the industry average at $11,109 per loan in Q3 2025, that fragmentation penalty translates to roughly $3,300 per file in hidden costs from labor inefficiency, integration maintenance, and compliance overhead.
Custom point-to-point integrations cost $25,000 to $100,000 each to build and require approximately 20% of that cost annually for maintenance. A lender with 8 custom integrations spends $50,000 to $100,000 per year just keeping them running. That maintenance budget buys no new capability, it only preserves existing functionality against vendor API changes and regulatory updates.
Disconnected systems create multiple audit scopes, inconsistent data, and gaps in access controls. The CFPB is pursuing a $20 million penalty for over 150,000 HMDA reporting errors caused by systemic data management deficiencies. Meanwhile, 97% of the top 100 U.S. banks experienced a third-party breach in 2024, and the average third-party breach costs $4.91 million. Each disconnected vendor in your stack is another attack surface and another compliance scope to manage. Microsoft Purview Audit Premium consolidates the audit trail across Exchange Online, SharePoint, OneDrive, and Teams into a single time-stamped record that produces examiner evidence on demand.
The mortgage industry lost 34% of its licensed loan originators between Q4 2021 and mid-2025, dropping from 125,000 to approximately 82,500. The average MLO is 45 years old, and only 10% are under 30. With a shrinking and aging workforce, lenders cannot afford to waste staff capacity on context switching between disconnected systems, each switch costs up to 23 minutes to refocus. Consolidation recovers that lost capacity without adding headcount.
A Microsoft Direct-Bill CSP transacts directly with Microsoft for customer licensing, holds dedicated Microsoft support engineers, and is operationally accountable to Microsoft for how customer tenants are configured. For a mortgage lender, that authorization is what allows a single operating partner to apply consistent Microsoft Entra ID, Intune, Defender, and Microsoft Purview controls across the lender's entire footprint under Granular Delegated Administrative Privileges (GDAP). That single-owner posture is the operational form of consolidation that turns Microsoft 365 from a license bundle into a compliance and productivity platform. ABT layers M365 Guardian, our financial-services operating model, on top of that relationship for the 750+ banks, credit unions, and mortgage companies in our footprint.
Start with a full technology inventory: catalog every SaaS subscription, custom integration, and manual data transfer in your operation. Industry data shows 52.7% of SaaS licenses go unused. Identify which tools overlap, which integrations cost the most to maintain, and where borrower data moves manually between systems. That inventory becomes the foundation for a prioritized consolidation plan focused on the highest-cost, highest-risk areas first, ideally onto a Microsoft 365 footprint operated by a Tier-1 Direct-Bill CSP under a defined operating model like M365 Guardian.